GRAPHICAL REPRESENTATION IN MATHS
Graphical representation brings data and ideas to life! It uses charts, graphs, and other visuals to make information clear, memorable, and easily understandable.
0
58
GRAPHICAL REPRESENTATION IN MATHS
- One way to look at number data is with a graphical representation. It shows in a diagram how facts, ideas, information, and thoughts are connected.
- One of the best ways to learn is to make things easy to understand. It always depends on what kind of information is in the area in question.
- Different kinds of graphs can be used to show different things. The following are some of them:
Line Graphs

- A line graph, also called a linear graph, shows continuous data and can be used to guess what will happen in the future over time.
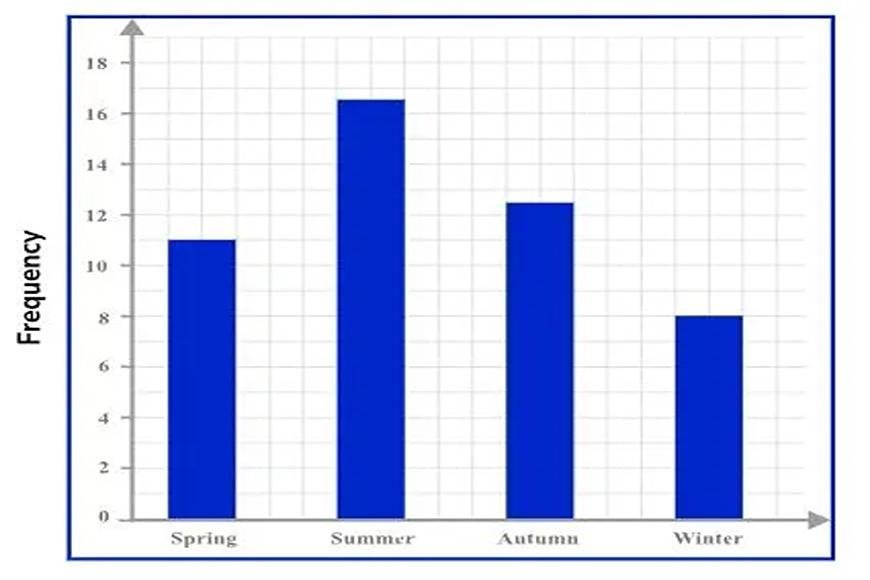
Bar graphs

- This type of graph shows the type of data and compares it by using uniform bars to show the amounts.
Histograms

- This type of graph uses bars to show how often numbers appear in groups that are organized into gaps.
- There are no breaks between the gaps, so each bar is the same depth.
Line Plot

- This type of graph shows how often data appears on a certain number line. Every time that data shows up again, "x" is put above a number line.
Frequency Table

- This table shows how many pieces of data fall within a certain range.
Circle Graph

- This type of graph, which is also called a "pie chart," shows how the parts of a whole matter. Each category has a specific number, such as 15%, 56%, etc., and the circle has a value of 100%.
Stem and Leaf Plot

- The data are put in this type of map from least important to most important.
- The stems are made up of the numbers with the next place value after the low place value.
- One type of map is the box and whisker plot, which summarizes the data by splitting it into four parts.
- The box and whisker plots show the data's range (spread) and median (middle value).
- Some general rules for showing data in graphs
- There are rules that must be followed in order for the information to be shown correctly in a graph.
These are them:
Suitable Title
- Make sure the graph clearly shows what the presentation is about by giving it the right title.
Measurement Unit
- Write down the graph's measurement unit.
Proper scale
- Pick the right size to show the information correctly.
Index
- To help you understand better, list the right colors, shades, lines, and designs in the plots.
Data Sources
- Put the source of the data at the bottom of the graph, where it's needed.
Keep it Simple
- Make a graph that is simple enough for anyone to understand.
Neat
- Pick the right styles, colors, sizes, etc. so that the graph can help you show information visually.
Representing Mathematically in Graphical Form
- Graphs are charts in math that show statistical data as curves or lines that go across a reference point that is written on the chart's surface.
- It helps to know how much one variable has changed in relation to another variable over a certain amount of time when looking at the relationship between two variables.
- You can better solve a problem by looking at both the series distribution and the frequency distribution. Two types of plots can be used to make data easy to see. These are the ones:
- Line plots like this one show trends over time.
- Graphs that show waveform distribution, like the frequency polygon graph.