FLOOD AND STREAM HYDROGRAPHS
Learn how to interpret hydrographs to understand flood patterns, stream flow, and water quality.
Flood and stream hydrographs
Overview of Stream and Flood Hydrographs
- An understanding of hydrograph analysis is essential to understanding the mechanics of water movement in rivers and streams.
- A hydrograph is a visual depiction of a stream or river's discharge or flow over time.
- Flood hydrographs are used to show how the flow rate changes over time during a flood event, notably floods.
- For the purpose of assessing flood risk and developing mitigation plans, hydrologists, engineers, environmental scientists, and policymakers rely heavily on these graphical representations, as they make it possible to foresee and control high water levels.
Components of a Flood Hydrograph
What Makes a Flood Hydrograph?
- Several essential elements are included in a typical flood hydrograph:
- Base Flow: In the event of no major precipitation or snowmelt, this is the stream or river's baseline or typical flow. On the graph, it is shown as the curve's lowest point.
- Rise Time (Rise Limb): This section shows the rise in water levels that happens after a downpour.
- A number of variables, including the drainage basin's features, soil moisture retention, and the amount of rainfall, affect how steep this slope is.
- Peak Discharge: The hydrograph's highest point shows the greatest flow rate that was attained during the flood event.
- It's an essential piece of information for determining how severe the flood was.
- The drop in water level that occurs after the peak discharge is known as the fall limb, or recession limb.
- The capacity of the river system to manage the extra water has an impact on the fall limb and is governed by several elements, including soil characteristics, groundwater absorption, and the shape of the river channel.
- The amount of time after a flood when water levels gradually return to their baseline is known as the recession period.
Factors Governing Flood Hydrographs
- A flood hydrograph's form and properties can be affected by a wide range of factors. Among them are:
- Precipitation intensity and duration: In comparison to shorter, less intense rainfall, heavy, protracted rain will produce a more dramatic rising limb and a greater peak discharge.
Conditions for antecedent moisture: Soils that are saturated accelerate runoff and increase peak discharge. - Features of a drainage basin: The base flow and the rate of runoff during a storm event are influenced by the basin's size, shape, plant cover, and type of soil.
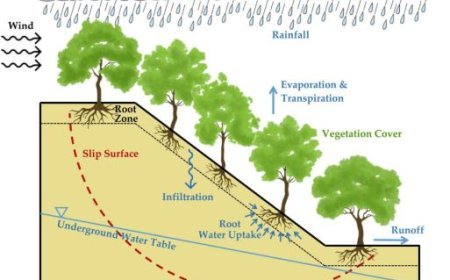
- Urbanization and changes in land use: More concrete and asphalt surfaces contribute to quicker and greater runoff, which in turn alters the appearance of flood hydrographs by reducing infiltration.
Utilization and Interpretation of Stream and Flood Hydrographs
- Interpreting hydrographs of streams and floods offers important information about:
- Flood forecasting: Models that anticipate future flood events may be created by analyzing previous hydrographs, which can help with planning and evacuation strategies.
- Hydrographs are used by engineers when designing levees, bridges, and other infrastructure components to withstand flooding.
- Emergency planning: Having a thorough awareness of the risk of flooding in various locations aids in the creation of warning systems and evacuation routes.
- Planning for sustainable land use requires an understanding of how different land management techniques impact water runoff, which hydrographs may help with.
What's Your Reaction?


